

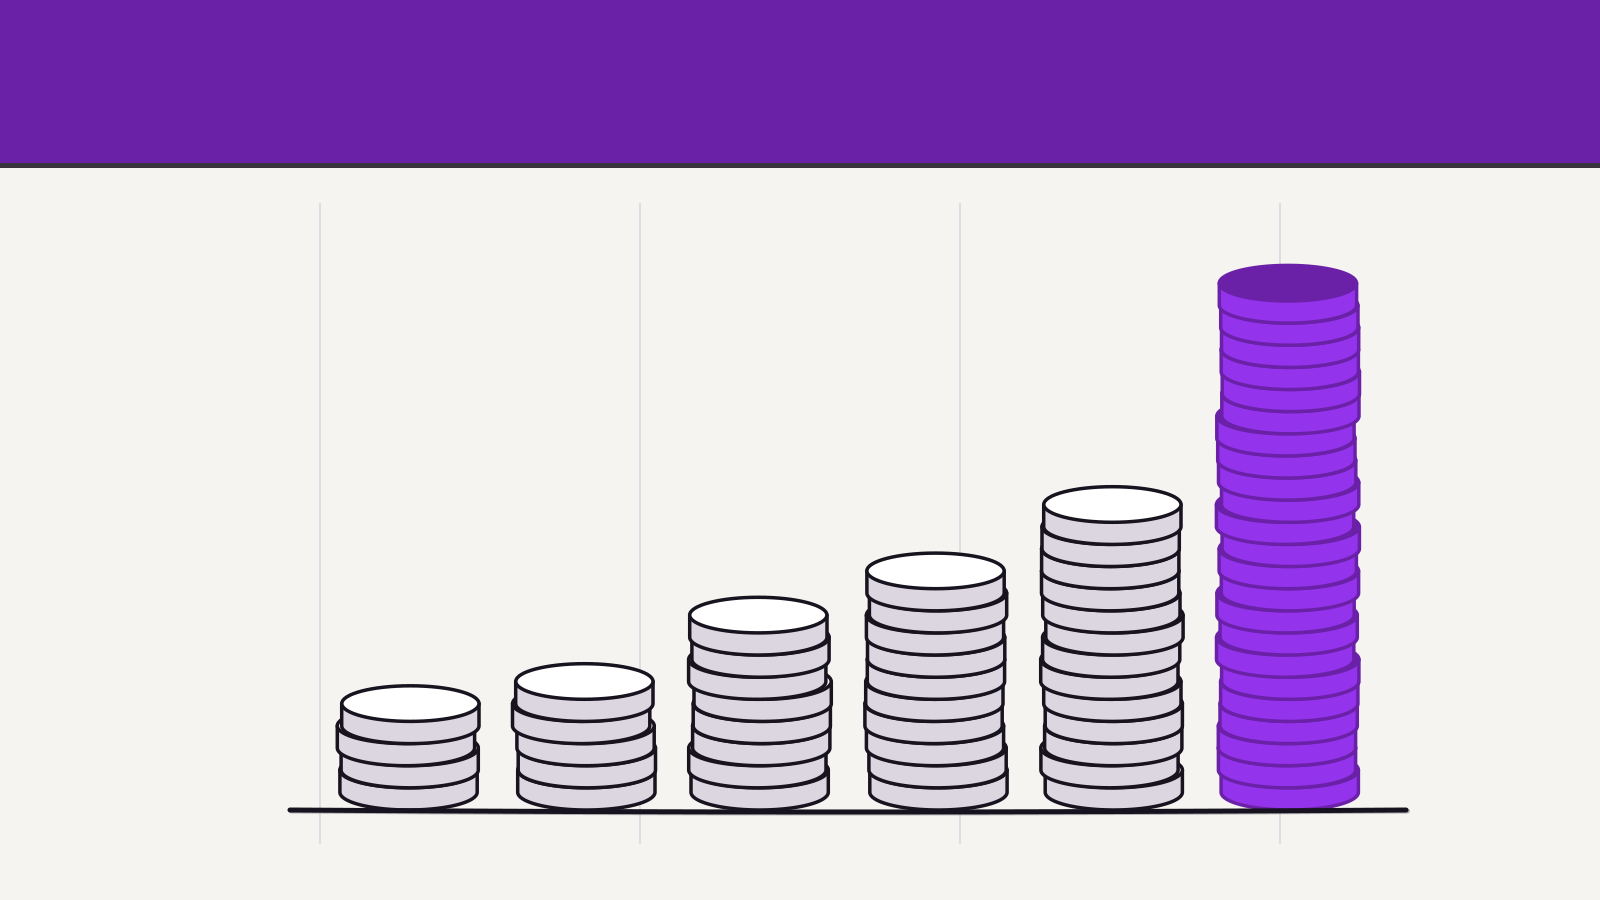
In Q1 2025 we built a 12-month acquisition plan for a client on an assumption that had held for 3 years: cost per qualified lead rises gradually as you scale spend, so you model a curve, find the point where it bends, and budget to just below it. Over 9 months that assumption stopped describing reality. Cost did not bend gradually. It was flat, then it stepped, twice, with nothing in between.
We had planned around a curve and the market gave us a staircase.
What we had been modelling
The conventional picture is diminishing returns. Early spend reaches the most reachable buyers cheaply, later spend reaches progressively harder ones, and the cost curve slopes upward smoothly. It is a good model. It matches most auction-based channels most of the time, and we had 3 years of our own data in HubSpot supporting it across this client's category.
Our plan set quarterly budgets at the point where marginal cost per qualified lead was still comfortably below the client's ceiling, with a review each quarter to move the line.
What actually happened
For 2 quarters costs were flat. Not gently rising, flat, while we increased spend by roughly a third. That should have prompted more curiosity than it did. A flat marginal cost while scaling means you have not yet exhausted the cheap audience, which is good news, and good news rarely gets audited.
Then in the space of about 3 weeks, cost per qualified lead rose by a large step and stayed there. We did the usual diagnostics and found nothing wrong internally. Two quarters later it stepped again.
Between the steps it was flat both times. At no point did we observe the gradual bend our model was built around.
What we did not understand at the time
The steps were not our curve bending. They were changes in the structure of the channel, and they were mostly not about us.
The first step coincided with a change in how a major surface presented results, which reduced the volume of clicks available for a set of queries without changing anything about their commercial intent. The pool did not get more expensive because we had exhausted it. The pool got smaller, and everyone bidding into it experienced the same step at the same time.
The second step had a different cause with the same shape: two additional competitors entered the category with funding and bid aggressively for a quarter.
Both are ordinary market events. What made them hard to see was that our model had no vocabulary for them. A diminishing returns curve is a model of our own behaviour, in which cost changes because we changed our spend. It has no term for the structure of the market changing underneath a constant strategy, and so every observation got interpreted as something we had done.
In retrospect, we spent most of 6 weeks after the first step looking for a fault in our own execution, because our model insisted the cause must be internal.
What we changed
First, we stopped modelling a single curve and started tracking the flat segments explicitly, with the working assumption that we are always on a plateau until something structural moves us to the next one. That is a less elegant model and it makes better predictions, which is the only test that matters.
Second, we added 3 external indicators to the monthly review that have nothing to do with our performance: available impression volume for the client's core query set, the count of distinct advertisers appearing against those queries, and the share of results occupied by non-organic elements. None of these are about us. All of them move before our costs do, and 2 of the 3 moved ahead of the second step in a way we could have acted on.
Third, and this is the planning consequence, we stopped writing 12-month acquisition budgets with a single cost assumption. We now write them with a stated plateau, a named set of events that would end it, and a pre-agreed response to each. The client's finance team liked this considerably more than the previous version, because a forecast that names its own failure conditions is easier to defend than one that projects a smooth line.
What I would tell someone planning around this
The general point is that a model of your own diminishing returns is a model of one variable in a system with several, and it will attribute every movement to that variable because it has nowhere else to put it. That is fine while the other variables are stable and actively misleading when they are not.
The practical version is to instrument something outside your own performance. Anything that describes the state of the market rather than the state of your account will do. We use available volume, competitor count and surface composition because they are cheap to pull, not because they are the only options. The value is not in the specific metric. It is in having any observation at all that can distinguish the market moved from we got worse, because without one every step change becomes an internal investigation.
The last thing I would say is about flat periods, which I now treat with more suspicion than expensive ones. Two quarters of flat cost while scaling spend felt like validation and was actually the absence of a signal. Nothing was pushing back on us yet. When the pushback arrived it arrived all at once, and we had built a plan that assumed we would get gradual warning. Our channel economics work is in our cost per qualified lead breakdown.
The client's cost per qualified lead is higher today than when we started, and the plan we run now anticipates that rather than treating each increase as a failure to be explained. That is a smaller claim than I would have made 2 years ago and considerably more useful to the people who have to budget against it.